Performance Engineering Series – Tuning for Performance - Case Study – 4
ActiveMQ Crash
Introduction
In this article let us look at an interesting case of ActiveMQ crashing and
the symptoms it showed up and how it was resolved. ActiveMQ is a widely used message broker that
talks via a wide range of sources.
In the current context, its used for the purpose of sending email
notifications where the test application places a message on the queue for it
to be consumed by other interfacing applications for email notification
delivery. The ActiveMQ runs in redundant
mode with active standby. If a node goes
down for any reason, the other node immediately picks up the processing and continues
until it goes down.
ActiveMQ is initiated using a wrapper which was designed off a community
release version and not the regular commercial deployment version. The limitation of this would be explained
later in the article.
Problem
It was observed that the ActiveMQ queue fills up due to pending messages
(or) the messages that cannot be delivered and end up in the DLQ (Dead Letter
Queue). This build up causes the disk space used by ActiveMQ to be filled
up.
From the applications perspective, the logic involves a UI action initiated by
the user to create an email which in turn has a DB side action to insert
particular data and update few other tables for housekeeping. This application side logic further branches
out in to asynchronous / synchronous methods.
In the first path, the application just places a message on the queue and
does not bother about the status of the message
But in the synchronous path, the application initiates a DB side transaction
that waits until the message is successfully processed by the consumer. This is where the problem started.
As the messaged piled up, the dependent application created more DB connections
to process new incoming requests that ate up the connection pool which
eventually leading the application in to an unresponsive state. The intent behind using these two paths were
unclear but it was necessary to first understand the problem and an attempt was
made to remediate it by external measures while the entire code was being
investigated for improvements.
As first step, this was replicated in the test environment in various use cases involving the email subsystem.
Diagnosis
The following images of ActiveMQ from the test system show the message
delivery issue -


Disk space problems
user@<node2>:/usr/share/activemq/data
[UNKNOWN]
# cd kahadb/
user@<node2>:/usr/share/activemq/data/kahadb
[UNKNOWN]
# du -sh
4.0G .
----------------------
user@node1:/usr/share/activemq/data
[UNKNOWN]
# cd kahadb/
user@node1:/usr/share/activemq/data/kahadb
[UNKNOWN]
# du -sh
2.6G .
user@node1:/usr/share/activemq/data/kahadb
[UNKNOWN]
JVM OOM messages
mq.broker.TransportConnection.Transport | ActiveMQ Transport: tcp:///xxxxxxxxx@616
| WARN | |
org.eclipse.jetty.util.thread.strategy.EatWhatYouKill | qtp1669904747-74
java.lang.OutOfMemoryError: GC overhead limit exceeded
| INFO | Refreshing
org.apache.activemq.xbean.XBeanBrokerFactory$1@4f6a5034: startup date []; root
of context hierarchy | org.apache.activemq.xbean.XBeanBrokerFactory$1 |
WrapperSimpleAppMain
| INFO | Using Persistence
Adapter:
MultiKahaDBPersistenceAdapter[/usr/share/activemq/bin/linux-x86-64/../../data/kahadb][KahaDBPersistenceAdapter[/usr/share/activemq/bin/linux-x86-64/../../data/kahadb/queue#3a#2f#2fActiveMQ.DLQ],
KahaDBPersistenceAdapter[/usr/share/activemq/bin/linux-x86-64/../../data/kahadb/#210]]
| org.apache.activemq.broker.BrokerService | WrapperSimpleAppMain
-----------------------------------
| WARN |
java.lang.OutOfMemoryError: GC overhead limit exceeded | org.eclipse.jetty.io.ManagedSelector |
qtp134105631-759
| WARN |
/api/jolokia/read/org.apache.activemq:type=Broker,brokerName=localhost |
org.eclipse.jetty.server.HttpChannel | qtp134105631-386
java.lang.OutOfMemoryError: GC overhead limit exceeded
at
sun.nio.cs.StreamEncoder.write(StreamEncoder.java:111)[:1.8.0_271]
at java.io.OutputStreamWriter.write(OutputStreamWriter.java:194)[:1.8.0_271]
at
org.json.simple.JSONObject.writeJSONString(JSONObject.java:69)[json-simple-1.1.1.jar:]
at
org.json.simple.JSONObject.writeJSONString(JSONObject.java:73)[json-simple-1.1.1.jar:]
at
org.json.simple.JSONValue.writeJSONString(JSONValue.java:135)[json-simple-1.1.1.jar:]
at
org.json.simple.JSONArray.writeJSONString(JSONArray.java:53)[json-simple-1.1.1.jar:]
at org.json.simple.JSONArray.writeJSONString(JSONArray.java:59)[json-simple-1.1.1.jar:]
at
org.json.simple.JSONValue.writeJSONString(JSONValue.java:135)[json-simple-1.1.1.jar:]
at
org.json.simple.JSONObject.writeJSONString(JSONObject.java:67)[json-simple-1.1.1.jar:]
at
org.json.simple.JSONObject.writeJSONString(JSONObject.java:73)[json-simple-1.1.1.jar:]
at
org.json.simple.JSONValue.writeJSONString(JSONValue.java:135)[json-simple-1.1.1.jar:]
at org.json.simple.JSONObject.writeJSONString(JSONObject.java:67)[json-simple-1.1.1.jar:]
at
org.json.simple.JSONObject.writeJSONString(JSONObject.java:73)[json-simple-1.1.1.jar:]
at
org.jolokia.util.IoUtil.streamResponseAndClose(IoUtil.java:34)[jolokia-core-1.6.2.jar:]
at org.jolokia.http.AgentServlet.sendStreamingResponse(AgentServlet.java:541)[jolokia-core-1.6.2.jar:]
at
org.jolokia.http.AgentServlet.sendResponse(AgentServlet.java:524)[jolokia-core-1.6.2.jar:]
at
org.jolokia.http.AgentServlet.handle(AgentServlet.java:336)[jolokia-core-1.6.2.jar:]
at
org.jolokia.http.AgentServlet.doGet(AgentServlet.java:277)[jolokia-core-1.6.2.jar:]
at
javax.servlet.http.HttpServlet.service(HttpServlet.java:687)[jetty-all-9.4.27.v20200227-uber.jar:9.4.27.v20200227]
at
javax.servlet.http.HttpServlet.service(HttpServlet.java:790)[jetty-all-9.4.27.v20200227-uber.jar:9.4.27.v20200227]
at
org.eclipse.jetty.servlet.ServletHolder$NotAsyncServlet.service(ServletHolder.java:1386)[jetty-all-9.4.27.v20200227-uber.jar:9.4.27.v20200227]
at
org.eclipse.jetty.servlet.ServletHolder.handle(ServletHolder.java:755)[jetty-all-9.4.27.v20200227-uber.jar:9.4.27.v20200227]
at
org.eclipse.jetty.servlet.ServletHandler$CachedChain.doFilter(ServletHandler.java:1617)[jetty-all-9.4.27.v20200227-uber.jar:9.4.27.v20200227]
at
org.eclipse.jetty.websocket.server.WebSocketUpgradeFilter.doFilter(WebSocketUpgradeFilter.java:226)[jetty-all-9.4.27.v20200227-uber.jar:9.4.27.v20200227]
at org.eclipse.jetty.servlet.ServletHandler$CachedChain.doFilter(ServletHandler.java:1604)[jetty-all-9.4.27.v20200227-uber.jar:9.4.27.v20200227]
at
org.eclipse.jetty.servlet.ServletHandler.doHandle(ServletHandler.java:545)[jetty-all-9.4.27.v20200227-uber.jar:9.4.27.v20200227]
at
org.eclipse.jetty.server.handler.ScopedHandler.handle(ScopedHandler.java:143)[jetty-all-9.4.27.v20200227-uber.jar:9.4.27.v20200227]
at
org.eclipse.jetty.security.SecurityHandler.handle(SecurityHandler.java:566)[jetty-all-9.4.27.v20200227-uber.jar:9.4.27.v20200227]
at
org.eclipse.jetty.server.handler.HandlerWrapper.handle(HandlerWrapper.java:127)[jetty-all-9.4.27.v20200227-uber.jar:9.4.27.v20200227]
at
org.eclipse.jetty.server.handler.ScopedHandler.nextHandle(ScopedHandler.java:235)[jetty-all-9.4.27.v20200227-uber.jar:9.4.27.v20200227]
at
org.eclipse.jetty.server.session.SessionHandler.doHandle(SessionHandler.java:1610)[jetty-all-9.4.27.v20200227-uber.jar:9.4.27.v20200227]
at org.eclipse.jetty.server.handler.ScopedHandler.nextHandle(ScopedHandler.java:233)[jetty-all-9.4.27.v20200227-uber.jar:9.4.27.v20200227]
Solution(s)
The problem was determined to be caused by the following factors -
- Undersized heap for the ActiveMQ
- Tuning requirement for ActiveMQ JVM
- Undersized KahaDB disk space
- Lack of monitoring of the queue (in test systems)
To fix the above problems, the following recommendations were given and these and were
implemented and tested in performance test system with good success
- Heap size increased to 4GB (from 1GB)
- GC algorithm changed to G1GC
- KahaDB space increased to 16GB (from 4GB)
- GC logs enabled for the JVM
- UI side monitoring enabled for the ActiveMQ
Edit the file '/usr/share/activemq/bin/linux-x86-64/wrapper.conf' to make
changes to heap size, GC algorithm and to enable GC logs as below -
# Initial Java Heap Size (in MB)
wrapper.java.initmemory=4096
# Maximum Java Heap Size (in MB)
wrapper.java.maxmemory=4096
NOTE: This is the max heap that can be set for the wrapper
irrespective of the total available memory due to the community release
version.
For higher heap sizes, an upgrade to this is also necessary as per this page
- https://activemq.apache.org/java-service-wrapper
wrapper.java.additional.13=-XX:+UseG1GC
wrapper.java.additional.14=-Xloggc:/var/log/activemq/activemq-gc-%t.log
wrapper.java.additional.15=-XX:+PrintGCDetails
<systemUsage>
<systemUsage
sendFailIfNoSpace="true">
<memoryUsage>
<memoryUsage percentOfJvmHeap="70" />
</memoryUsage>
<storeUsage>
<storeUsage limit="16 gb"/>
</storeUsage>
<tempUsage>
<tempUsage limit="16 gb"/>
</tempUsage>
</systemUsage>
</systemUsage>
Additionally, in the test system all the pending messages were discarded
upon restart by the addition of this parameter →
deleteAllMessagesOnStartup="true"
<broker xmlns="http://activemq.apache.org/schema/core"
brokerName="localhost" deleteAllMessagesOnStartup="true"
dataDirectory="${activemq.data}"
schedulerSupport="true">
NOTE - This needs to be implemented with caution in production
systems as its necessary to account for the undelivered messages in many cases
to identify and issues.
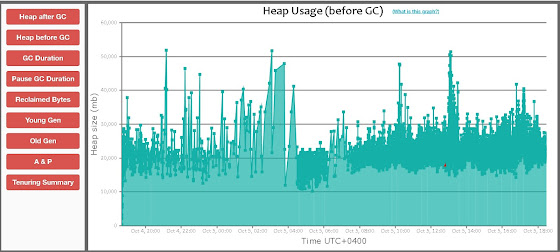
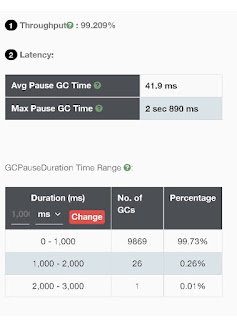
Results in test systems
After this change, the ActiveMQ processed around 60 messages / sec without
any crash issues and the heap was also fully utilized in a healthy pattern
without excessive GC
Following screen shots show the usage (node1 currently active) -


GC log entries of ActiveMQ after the changes
12662.436: [GC pause (G1 Evacuation Pause) (young), 0.0353496 secs]
[Parallel Time: 33.5 ms, GC Workers: 8]
[GC Worker Start (ms): Min: 12662436.2, Avg:
12662436.4, Max: 12662436.7, Diff: 0.6]
[Ext Root Scanning (ms): Min: 0.3, Avg: 0.6, Max: 1.1,
Diff: 0.8, Sum: 5.1]
[Update RS (ms): Min: 18.6, Avg: 25.4, Max: 26.8, Diff:
8.2, Sum: 203.5]
[Processed Buffers: Min: 48, Avg: 63.5,
Max: 72, Diff: 24, Sum: 508]
[Scan RS (ms): Min: 0.0, Avg: 0.1, Max: 0.1, Diff: 0.1,
Sum: 0.4]
[Code Root Scanning (ms): Min: 0.0, Avg: 0.0, Max: 0.0,
Diff: 0.0, Sum: 0.0]
[Object Copy (ms): Min: 5.5, Avg: 6.9, Max: 14.2, Diff:
8.7, Sum: 55.1]
[Termination (ms): Min: 0.0, Avg: 0.0, Max: 0.0, Diff:
0.0, Sum: 0.0]
[Termination Attempts: Min: 1, Avg: 2.4,
Max: 5, Diff: 4, Sum: 19]
[GC Worker Other (ms): Min: 0.0, Avg: 0.1, Max: 0.2,
Diff: 0.2, Sum: 0.7]
[GC Worker Total (ms): Min: 32.8, Avg: 33.1, Max: 33.3,
Diff: 0.5, Sum: 264.9]
[GC Worker End (ms): Min: 12662469.4, Avg: 12662469.5,
Max: 12662469.6, Diff: 0.2]
[Code Root Fixup: 0.0 ms]
[Code Root Purge: 0.0 ms]
[Clear CT: 0.4 ms]
[Other: 1.4 ms]
[Choose CSet: 0.0 ms]
[Ref Proc: 0.4 ms]
[Ref Enq: 0.0 ms]
[Redirty Cards: 0.4 ms]
[Humongous Register: 0.1 ms]
[Humongous Reclaim: 0.0 ms]
[Free CSet: 0.3 ms]
[Eden: 584.0M(584.0M)->0.0B(564.0M) Survivors:
10.0M->24.0M Heap: 3654.4M(4096.0M)->3085.4M(4096.0M)]
[Times: user=0.25 sys=0.00, real=0.04 secs]
Next steps
As described in the initial sections, it was necessary to check the
application code logic which caused the DB connections to saturate. In addition to it, the recommendation to move
to a commercial edition of the wrapper from the community edition was also
recommended. This being a very old
application, such problems were never faced in the past because of which the change
in the wrapper never came in to focus.
But with the growth in the usage of the application over the years, the
limitations have become evident and hence required a detailed investigation.
Conlusions and learning
I hope this article presented an overview of how ActiveMQ is used and the areas to look in to in case of any issues without getting in to the actual application code. There is an ocean of documentation around ActiveMQ with lot of discussion forums discussing about associated problems and I urge the reader to browse through to gain further knowledge.
Finally, as I always state, there could be many solutions to a problem and the
implementation of a particular solution depends on the though process employed
and may not be the only one. This
statement also holds good in the current situation and I would want the reader
to further debug to discover any potential alternative solutions /
approaches.
Cheers and see you in another article!