Performance Engineering Series – Tuning for Performance - Case Study – 3
A curious case of continuous Full GC’s with G1GC
Introduction
Continuing on the previous articles where I had explained
about tuning a JVM and the parameters involved, this article specifically deals
with a curious case of the same JVM dumping out some unexpected messages in the
logs during internal tests, the investigation and the final outcome.
Readers are expected to browse through the previous articles
to get a better context of what is being discussed here.
The performance test environment consists of a replica of
the entire setup in an exact similar architecture to what is deployed in
production. The test engineers do
extensive tests in different conditions to simulate production conditions and
to understand the behavior of the application in various conditions.
For first time readers let me (re)introduce the application
under discussion -
This particular application is responsible for Indexing and
Search for the entire data that lives in the system. The design is based on Lucene and is quite
dated but has scaled well in the many years of its existence.
The application runs on a JVM with JDK8 on an Oracle Linux
VM with 64vCPU and 320GB RAM on the cloud.
The application heap was at about 64GB prior to this additional tuning
with the following GC parameters which were put in place -
-XX:ConcGCThreads=24 -XX:G1HeapRegionSize=8388608
-XX:G1ReservePercent=25 -XX:InitialHeapSize=64424509440
-XX:InitiatingHeapOccupancyPercent=35 -XX:MaxHeapSize=64424509440
-XX:ParallelGCThreads=60 -XX:+ParallelRefProcEnabled -XX:+PrintGC
-XX:+PrintGCDateStamps -XX:+PrintGCDetails -XX:+PrintGCTimeStamps
-XX:+PrintHeapAtGC -XX:+PrintTenuringDistribution -XX:+UseG1GC
Problem definition, investigation and remedial path -
This particular task does a job of full re-indexing of the
existing Lucene index and it generates the index by retrieving the information
from its source of truth which is the data in the back end database. Whenever large data gets ingested in to the
database, it is necessary to update the other dependent systems, here in this
case the Lucene index. During this process, it was observed that the
indexing does not happen and the JVM just stops and shows no activity / CPU
usage.
A
quick check on the application logs showed these messages –
logger=com.zaxxer.hikari.pool.HikariPool|tid=microsoft-datasource housekeeper|rid=|rgi=|uid=|pid=|orgid=|iuid=|clientName=|ip=|message=microsoft- -datasource - Thread starvation or clock leap detected (housekeeper delta=46s771ms984µs607ns).logger=com.zaxxer.hikari.pool.HikariPool|tid=microsoft-datasource housekeeper|rid=|rgi=|uid=|pid=|orgid=|iuid=|clientName=|ip=|message=microsoft-datasource - Thread starvation or clock leap detected (housekeeper delta=1m12s725ms455µs373ns).logger=com.zaxxer.hikari.pool.HikariPool|tid=microsoft-datasource housekeeper|rid=|rgi=|uid=|pid=|orgid=|iuid=|clientName=|ip=|message=microsoft- -datasource - Thread starvation or clock leap detected (housekeeper delta=46s653ms222µs683ns).Out of suspicion the GC logs were inspected, which showed this pattern of GC -

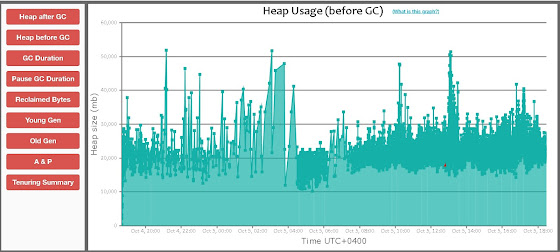
This was like an emergency fire alarm going off. So many red colored events on a GC graph with
G1GC? This was a totally new behavior which was never seen before, so, it
definitely required some investigation.
The CPU utilization pattern also tapered off from a high activity to none during this period as below.

[Eden: 0.0B(4608.0M)->0.0B(4608.0M) Survivors: 0.0B->0.0B Heap: 87.5G(90.0G)->87.5G(90.0G)]
Heap after GC invocations=3264 (full 504):
garbage-first heap total 94371840K, used 91744868K [0x00007fa1e0000000, 0x00007fa1e0816800, 0x00007fb860000000)
region size 8192K, 0 young (0K), 0 survivors (0K)
Metaspace used 128784K, capacity 132466K, committed 134400K, reserved 135168K
}
[Times: user=0.43 sys=0.02, real=0.06 secs]
{Heap before GC invocations=3264 (full 504):
garbage-first heap total 94371840K, used 91744868K [0x00007fa1e0000000, 0x00007fa1e0816800, 0x00007fb860000000)
region size 8192K, 0 young (0K), 0 survivors (0K)
Metaspace used 128784K, capacity 132466K, committed 134400K, reserved 135168K
2023-03-15T06:10:58.959-0400: 1196.439: [GC pause (G1 Evacuation Pause) (young)
Desired survivor size 301989888 bytes, new threshold 15 (max 15)
, 0.0506115 secs]
[Parallel Time: 4.8 ms, GC Workers: 60]
[GC Worker Start (ms): Min: 1196455.5, Avg: 1196456.2, Max: 1196457.0, Diff: 1.5]
[Ext Root Scanning (ms): Min: 0.0, Avg: 0.4, Max: 3.8, Diff: 3.7, Sum: 26.8]
[Update RS (ms): Min: 0.0, Avg: 0.4, Max: 0.7, Diff: 0.7, Sum: 21.9]
[Processed Buffers: Min: 0, Avg: 0.5, Max: 1, Diff: 1, Sum: 29]
[Scan RS (ms): Min: 0.0, Avg: 0.0, Max: 0.0, Diff: 0.0, Sum: 0.0]
[Code Root Scanning (ms): Min: 0.0, Avg: 0.0, Max: 0.0, Diff: 0.0, Sum: 0.0]
[Object Copy (ms): Min: 0.0, Avg: 0.0, Max: 0.1, Diff: 0.1, Sum: 0.9]
[Termination (ms): Min: 0.0, Avg: 2.3, Max: 2.6, Diff: 2.6, Sum: 135.9]
[Termination Attempts: Min: 1, Avg: 1.0, Max: 1, Diff: 0, Sum: 60]
[GC Worker Other (ms): Min: 0.0, Avg: 0.0, Max: 0.0, Diff: 0.0, Sum: 0.3]
[GC Worker Total (ms): Min: 2.3, Avg: 3.1, Max: 3.8, Diff: 1.4, Sum: 185.9]
[GC Worker End (ms): Min: 1196459.3, Avg: 1196459.3, Max: 1196459.4, Diff: 0.1]
[Code Root Fixup: 0.0 ms]
[Code Root Purge: 0.0 ms]
[Clear CT: 1.6 ms]
[Other: 44.1 ms]
[Choose CSet: 0.0 ms]
[Ref Proc: 23.8 ms]
[Ref Enq: 1.6 ms]
[Redirty Cards: 1.6 ms]
[Humongous Register: 16.2 ms]
[Humongous Reclaim: 0.6 ms]
[Free CSet: 0.1 ms]
[Eden: 0.0B(4608.0M)->0.0B(4608.0M) Survivors: 0.0B->0.0B Heap: 87.5G(90.0G)->87.5G(90.0G)]
Heap after GC invocations=3265 (full 504):
garbage-first heap total 94371840K, used 91744868K [0x00007fa1e0000000, 0x00007fa1e0816800, 0x00007fb860000000)
region size 8192K, 0 young (0K), 0 survivors (0K)
Metaspace used 128784K, capacity 132466K, committed 134400K, reserved 135168K
}
[Times: user=0.44 sys=0.02, real=0.05 secs]
{Heap before GC invocations=3265 (full 504):
garbage-first heap total 94371840K, used 91744868K [0x00007fa1e0000000, 0x00007fa1e0816800, 0x00007fb860000000)
region size 8192K, 0 young (0K), 0 survivors (0K)
Metaspace used 128784K, capacity 132466K, committed 134400K, reserved 135168K
2023-03-15T06:10:59.010-0400: 1196.491: [Full GC (Allocation Failure)
There were about 500 Full GC’s that occurred and this definitely indicated a problem either with the tuning (or) hinted towards an undersized heap.
This excessive Full GC’s caused the application threads to get paused for such a long time that the application does not get the work time quantum to work on its internal housekeeping causing it to go in to an irrecoverable state which eventually causes the CPU utilization to drop and no work is done, although the application is in a running state from an OS perspective. As a result of this the application logs displayed the ‘thread starvation or clock leap’ messages.
Citing this as a problem related to an undersized heap, the heap size was bumped up to 90GB and the concurrent threads where increased from 24 to 32. Rest of all the parameters were retained as-is. But even this didnt alleviate the Full GC's but however they reduced considerably -
[Eden: 0.0B(4608.0M)->0.0B(4608.0M) Survivors: 0.0B->0.0B Heap: 87.5G(90.0G)->87.5G(90.0G)]
Heap after GC invocations=2668 (full 322):This gave a hint that we were proceeding on the right path.So, the next change was to increase the heap further to 120GB with parallel GC threads set to 90 and concurrent threads set to 64.This change further reduced the full GC count to about 67 but didnt provide the intended result -[Eden: 19.0G(19.0G)->0.0B(36.5G) Survivors: 672.0M->840.0M Heap: 37.9G(120.0G)->16.4G(120.0G)]Heap after GC invocations=7346 (full 67):Finally the last change was to increase the heap to about 150GB with the followign parameters --XX:+UseG1GC -XX:G1HeapRegionSize=8M -XX:ParallelGCThreads=90 -XX:ConcGCThreads=48 -XX:G1ReservePercent=25 -XX:InitiatingHeapOccupancyPercent=35 -XX:+ParallelRefProcEnabled -XX:+UseCompressedClassPointers -XX:+UseCompressedOops -XX:+PrintGCDetails-XX:+PrintHeapAtGC -XX:+PrintGCDateStampsOne might get a doubt as to how can the threads be higher than the total number of CPU's available on the system which is 64 in this case. The answer to this is simple - as long as the change does not cause CPU starvation / extended period of peak usage causing problems in the application, its permissible to go beyond the allocated limit.This was the final GC performance graph -Conclusions and UnderstandingThe applications heap usage and behavior is dynamic and will depend on the work load and data volumes. Building an environment similar to production in terms of infrastructure capacity might be an easy thing, but getting the data inside of it is a tricky thing due to the various operational factors involved. So, its always good to keep the data volumes in comparable capacity to what is actually there in production. We cannot test a system that has about 5TB of data against 100GB of data and assess its performance. It would be virtually impossible to predict what would happen at that scale. Although its an arguable point that extrapolation can be utilized, but such a scale of extrapolation loses its accuracy. But one can test with 1TB of data and probably estimate what can happen at 5TB. So, scale is an important take away of this tuning exercise which the test engineers need to consider while assessing performance.