Performance Engineering Series – Tuning for Performance - Case Study - 1
Introduction
This series of articles will introduce the reader to explore
more about Performance Engineering, specifically how to deal with actual issues
of the product in a production deployment scenario. This is the most discussed area and most of
the people I have interacted with look forward to getting in to this role and
deal with actual issues and make their contribution.
This work requires knowledge and understanding from a
multitude of aspects like –
- The product design
- Usage profile of the product
- CPU and Memory and Disk configuration of the platform
- Software configuration – Memory settings
- Connected software components and their impact
The reader is expected to look at the problem holistically
to make the best use of the resources being deployed and then tune the
application to obtain the required performance.
As this spans a multitude of areas, extensive knowledge of
all the areas is necessary and this comes mostly by experience. So, its always advisable for the readers to
proactively examine all the available artifacts from which they can draw their
own conclusions which can be later compared to the actual solution points to
better their understanding.
Finally this is a continuous process and each case provides
a unique insight in to ‘what else’ can be done to make the application better
and to provide a better customer satisfaction.
With this introduction, let us get in to our first case
which is the most recent one which I have worked on.
Case Study of JVM Tuning - Introduction
This particular problem was presented to me with the
following symptoms –
- Frequent unavailability of the application (crash issues)
- Significant degraded performance in repeated spells
Background
To give a brief background, this particular application is
responsible for Indexing and Search for the entire data that lives in the
entire system. The design is based on
Lucene and is quite dated but has scaled well in the many years of its
existence.
The application runs on a JVM with JDK8 on an Oracle Linux
VM with 48vCPU and 320GB RAM on the cloud.
The application heap currently stood at 63GB and with the following GC
parameters at the time of reporting the problem -
XX:ConcGCThreads=18 -XX:G1HeapRegionSize=4194304
-XX:G1ReservePercent=20 -XX:InitialHeapSize=67645734912 -XX:InitiatingHeapOccupancyPercent=30
-XX:MaxGCPauseMillis=500 -XX:MaxHeapSize=67645734912
-XX:+ParallelRefProcEnabled -XX:+UseG1GC
From the above GC parameters, it can be understood that some
tuning was performed earlier which worked well until the crash problem +
degraded performance started to show. These
were the major issues and inferences after looking at the GC log(s)
- Heap not being fully utilized. It doesn’t grow due to the parameters involved.
- Despite too many cycles, not much is reclaimed.
- Mixed GC’s
- Long lived objects
- Humongous objects (allocation request > 50% of current region size)
- Region size – Currently at 4MB. Larger the region size, higher the wastage, but smaller the size, higher the GC time to be spent to clear
- GC activity comparatively higher
- CPU activity around the 50% mark for the entire duration of application activity.
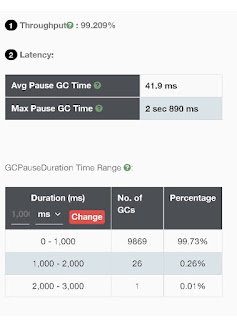
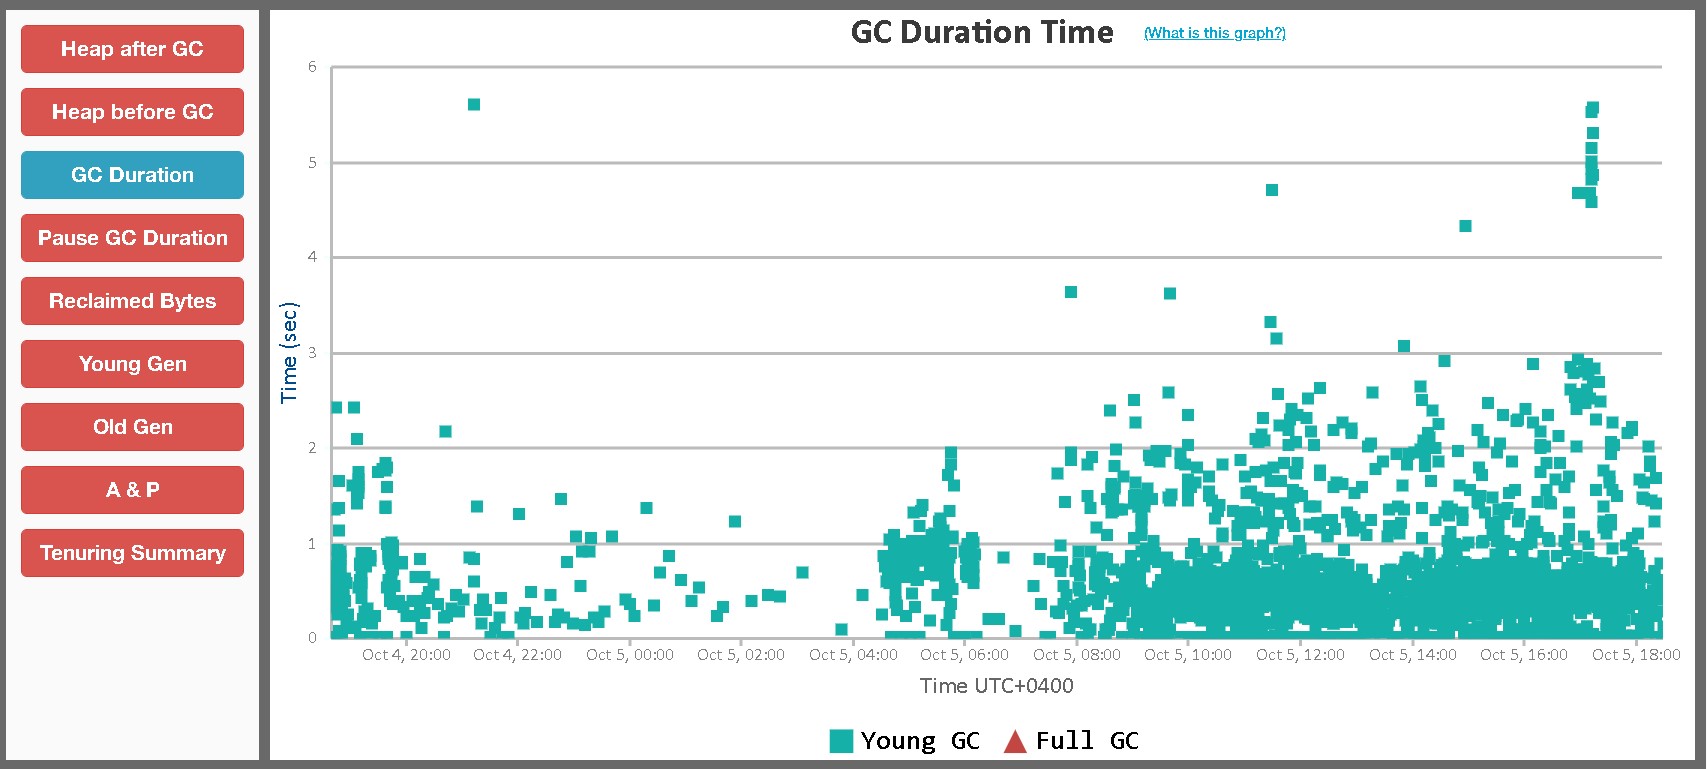
These are some of the GC graphs prior to the attempted
tuning (more below). All these graphs are courtesy of the website https://gceasy.io.
All credits to them!


Tuning process and outcomes
As a first thing, the JDK version was checked as there is a
process that the organization follows which requires that the JDK version be
consistent across. But it was found that
at bundled patch update also upgraded to the JDK to a minor version in the
1.8.xxx.
Crash problem analysis
The crash investigation led way to some previously reported
issues which involved calls to JNI library, specifically the network at a time
when the JVM was busy with GC activity and all the threads are blocked to
complete the activity. The JVM
eventually crashed with these errors –
# A fatal
error has been detected by the Java Runtime Environment:
#
# SIGSEGV
(0xb) at pc=0x00007f83cfd3a9d5, pid=2704, tid=0x00007f83ce50e700
#
# JRE
version: Java(TM) SE Runtime Environment (8.0_271-b25) (build 1.8.0_271-b25)
# Java VM:
Java HotSpot(TM) 64-Bit Server VM (25.271-b25 mixed mode linux-amd64 )
#
Problematic frame:
# V
[libjvm.so+0x5b39d5] G1ParScanThreadState::copy_to_survivor_space(InCSetState,
oopDesc*, markOopDesc*)+0x35
#
# Failed to
write core dump. Core dumps have been disabled. To enable core dumping, try
"ulimit -c unlimited" before starting Java again
#
# An error
report file with more information is saved as:
#
/tmp/hs_err_pid2704.log
#
# If you
would like to submit a bug report, please visit:
#
http://bugreport.java.com/bugreport/crash.jsp
#
A search on the internet showed these existing bugs reported for the above errors and were linked to JNI calls –
- https://jira.atlassian.com/browse/JRACLOUD-64255
- https://bugs.openjdk.org/browse/JDK-8143310
- https://bugs.openjdk.org/browse/JDK-8035329
- https://bugs.openjdk.org/browse/JDK-8163536
The code
being called in this particular application was pretty old and did not show any
possible connections with JNI calls as described. But it was definitely something to look out
for.
Degraded Performance Analysis
-XX:ConcGCThreads=16
-XX:G1ReservePercent=15 -XX:InitiatingHeapOccupancyPercent=40 -XX:ParallelGCThreads=48
-XX:G1HeapRegionSize=4194304
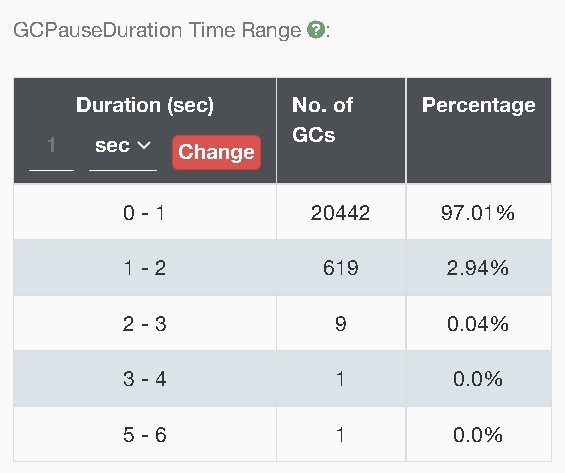
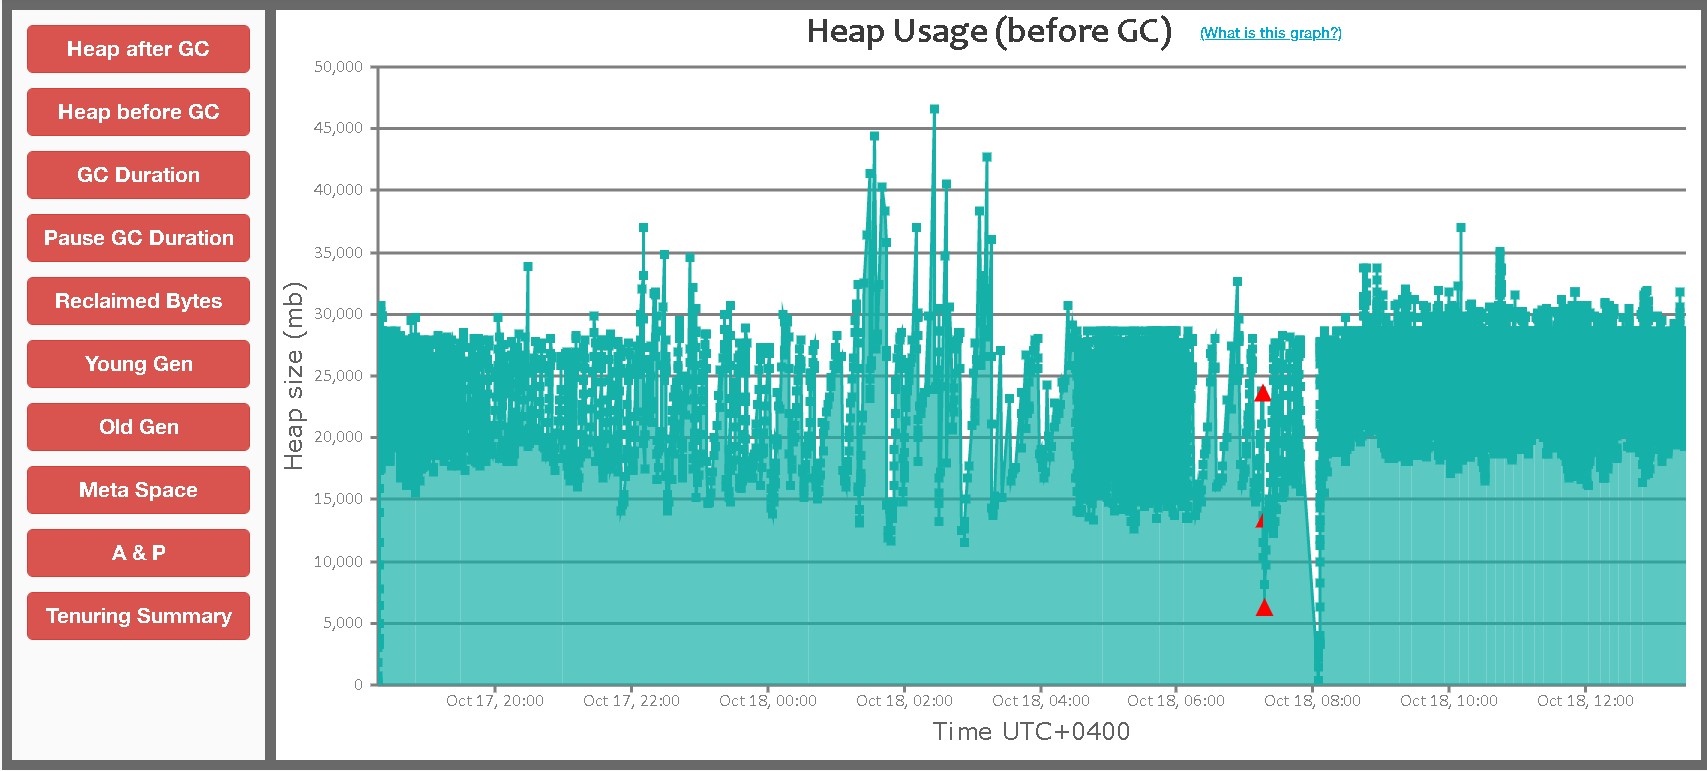
After making the above changes, there was a slight
improvement in the performance but was not very consistent. These are the GC graphs after applying the
above parameters -


After applying the tuning parameters, in the meanwhile, additional data from NMON was also investigated to understand the amount of additional CPU head room available. The GC logs were examined in detail to get and understanding and have been categorized as below along with the remedial actions for each of them -
Log entry
[G1Ergonomics (Mixed GCs) start mixed GCs, reason: candidate old regions available, candidate old regions: 1549 regions, reclaimable: 4541130480 bytes (6.71 %), threshold: 5.00 %
Problem – Lot of regions getting filled up quickly and the threshold is at default of 5%.
Proposed Solution -
-XX:G1HeapWastePercent=10
This gives more head room for the objects to be alive but it
will also have an impact on the overall size of the heap.
For the current 60GB, 5% would be 3GB. But with it being increased to 10%, the
wasted space would be 6GB. So, the
proposal is to increase the heap to 70GB.
Log entry
G1Ergonomics (Concurrent Cycles) request concurrent cycle initiation, reason: occupancy higher than threshold, occupancy: 21848129536 bytes, allocation request: 4809696 bytes, threshold: 20293720470 bytes (30.00 %), source: concurrent humongous allocation]
[G1Ergonomics (Concurrent Cycles) do not request concurrent
cycle initiation, reason: still doing mixed collections, occupancy: 21055406080
bytes, allocation request: 134217752 bytes, threshold: 20293720470 bytes (30.00
%), source: concurrent humongous allocation]
The allocation requests (in MB) from the application were
like this (computed after filtering out the data after copying to a spreadsheet) –
|
4.586884 |
364.9705 |
8.974113 |
2.962227 |
5.730789 |
88.24471 |
5.70269 |
9.895233 |
|
2.108994 |
4.586884 |
8.974113 |
182.4853 |
5.55349 |
5.70269 |
2.705833 |
5.70269 |
|
4.586884 |
8.974113 |
8.974113 |
25.06779 |
4.586884 |
364.9705 |
78.94887 |
8.974113 |
|
5.172989 |
8.974113 |
5.70269 |
2.108994 |
5.70269 |
5.70269 |
4.586884 |
4.586884 |
|
3.312172 |
8.974113 |
9.895233 |
39.72817 |
30.17077 |
8.974113 |
44.12237 |
5.70269 |
|
5.70269 |
5.70269 |
9.895233 |
8.493942 |
3.538147 |
8.974113 |
4.586884 |
5.70269 |
|
2.331924 |
9.895233 |
9.895233 |
2.62748 |
4.586884 |
8.974113 |
5.70269 |
5.70269 |
|
4.586884 |
9.895233 |
4.586884 |
3.121033 |
4.586884 |
4.586884 |
2.484375 |
|
|
4.586884 |
9.895233 |
8.974113 |
4.586884 |
2.000023 |
2.108994 |
12.58921 |
|
|
8.974113 |
4.586884 |
4.586884 |
2.887321 |
8.641792 |
3.450066 |
3.176476 |
|
Proposed Solution
– Increase the region size to the next size 8MB. Although this doesn’t completely solve the
issue but it would reduce the fragmentation that would be caused by multiple
empty regions and this will finally have a positive effect on the concurrent GC
cycles
Log Entry
[G1Ergonomics (CSet Construction) finish
choosing CSet, eden: 705 regions, survivors: 101 regions, old: 0 regions,
predicted pause time: 2814.90 ms, target pause time: 200.00 ms]
Problem – Pause
time goals
In the first set of tuning values, the MaxGCPauseMillis was
set to a value of 500ms. Although the
overall average added up to this number, the 90th percentile was
about 700ms.
The second set of tuning where this value was removed, it
defaulted to a value of 200ms. In this
spell, the 90% average was 650ms.
Proposed solution – Leave it at the current default value of 200ms and observe the performance for a few days (or) change the value to somewhere around 300-400ms to arrive at a sweet spot and give more head room to the JVM
Other parameters, their
significance and the path forward
XX:G1ReservePercent=15 – This parameter worked well, and
there were no to-space issues, so this can be left as-is
-XX:InitiatingHeapOccupancyPercent=40 – This also didn’t
show much impact, so, it either can be left at this number or reduced to the
previous number of 30 so that the marking cycle can start early. This can be taken up later.
Final list of GC parameters
proposed
-XX:G1HeapRegionSize=8M -XX:ConcGCThreads=16
-XX:ParallelGCThreads=48 -XX:InitiatingHeapOccupancyPercent=40
-XX:+ParallelRefProcEnabled -XX:G1ReservePercent=15 -XX:G1HeapWastePercent=10
HEAPSIZE=70g
Results and outcome
Based on the above investigations, firstly the JDK version
as reverted to a more stable standardized sub version.
The application of the final recommended GC parameters,
stabilized the instance to a great extent and the problem of crashes / degraded
performance was not reported.
Conclusion and take away
This article should have provided an overall perspective of
dealing with a production incident and the approach that was taken to
identifying and root causing the problem and then finally suggesting a remediation.
The tuning options recommended were very specific to this
particular use case and usually remain unique for each and every
application. It is up to the engineers
working on the problem to take reference of these and then adapt / modify them
appropriately for their specific requirement as there is no ‘one size
fits all’ concept. The same problem could have been dealt with a different set of tuning parameters, and this is one of the many approaches and does not necessarily make this the only one solution. Its up to the engineers who are workign on such problems to be intrigued and invest time in investigation and experiment as much to get things right.
On a closing note, I would like to appreciate the time you have spent to read through this article and I hope it would have provided some insight and
a path to deal with such problems. All
the best and I would see you next time with another problem. Until then, stay tuned!